Video Quality Analyzer
Full-reference solution to measure perceived video quality, audio quality and audio/video synchronization (lipsync)
And also: measures of blockiness, blur, contrast and flatness for both the reference video and the measured video.
Measure of video quality by type of zone (texture, contour, ...) and detailed quality/classification statistics.
Also includes Netflix's VMAF.
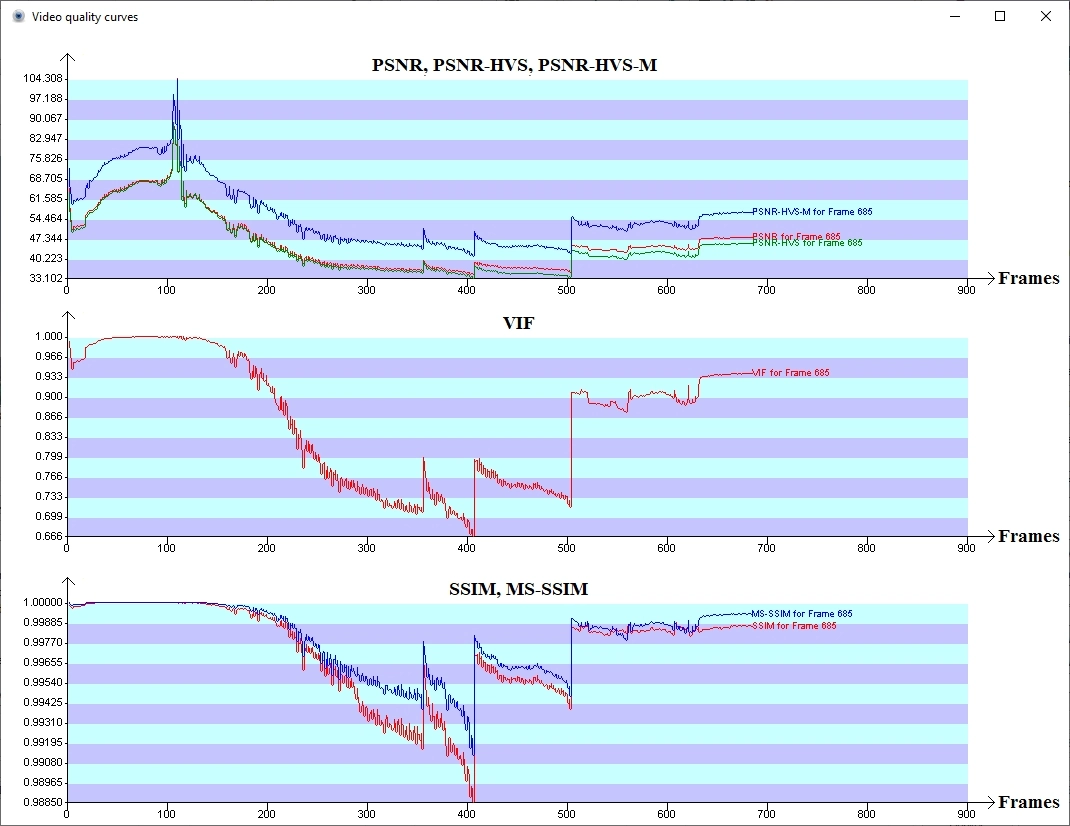
Also includes PSNR, PSNR-HVS, PSNR-HVS-M, VIF, SSIM, MS-SSIM.
Definitely the most precise tool to benchmark video encoders.
Note:
- If you are looking for an equivalent solution but for live audio/video signals (IP streaming, HDMI, SDI, etc.), try "Full Reference Video Quality Monitor".
- If you are looking for a similar solution but without reference, try "Video Quality Monitor".
In 2025, Video Quality Analyzer was finalist for this award:


Using AI and more specifically machine learning, Video Quality Analyzer (VQA) is a very powerful software solution to precisely measure and analyze the video quality perceived by end-users (also called QoE: Quality of Experience).
VQA also enables to measure the skew between audio and video (lip sync offset).
VQA is mainly designed for:
- video equipment benchmarking and optimization (example: video encoders performance benchmarking)
- video equipment R&D (example: video encoders R&D)
- compare blockiness, blur, contrast and flatness between two videos
- monitoring of file-based video encoding processes (example: encoding for VOD)
- automatic encoding/transcoding of audio video files by choosing the quality of produced files (you choose the quality instead of choosing the bitrate !)
- measuring the synchronization between audio and video (lipsync) from files
VQA is a software product for Windows. It is easy to install. It can run on virtually any PC. It can even run on a laptop. If possible, the recommended configuration is: 4-core CPU (or more), 3 GB of RAM.
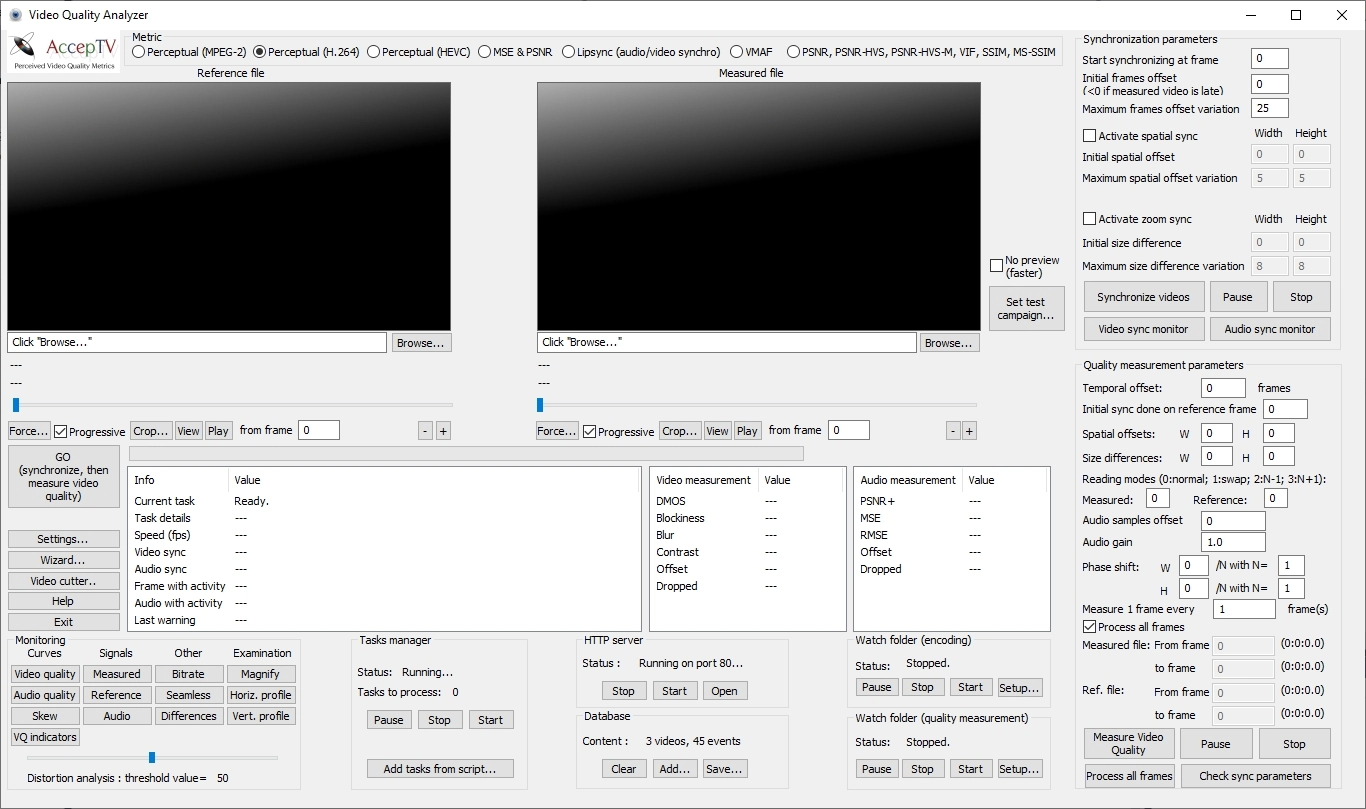
Starting VQA
At start up, VQA displays a window showing two video preview frames: one for the reference video and one for the distorted video (that you want to measure). To start using VQA, you generally click a "Browse..." button in order to select a video file (reference or distorted video) and load it.
VQA supports the most common encoding formats: MPEG-2, MPEG-4/AVC (H.264), HEVC (H.265), uncompressed YUV, ... in the most used containers: MP4, AVI, TS, PS, ES, MOV, DPX, WMV, etc.
Videos loading
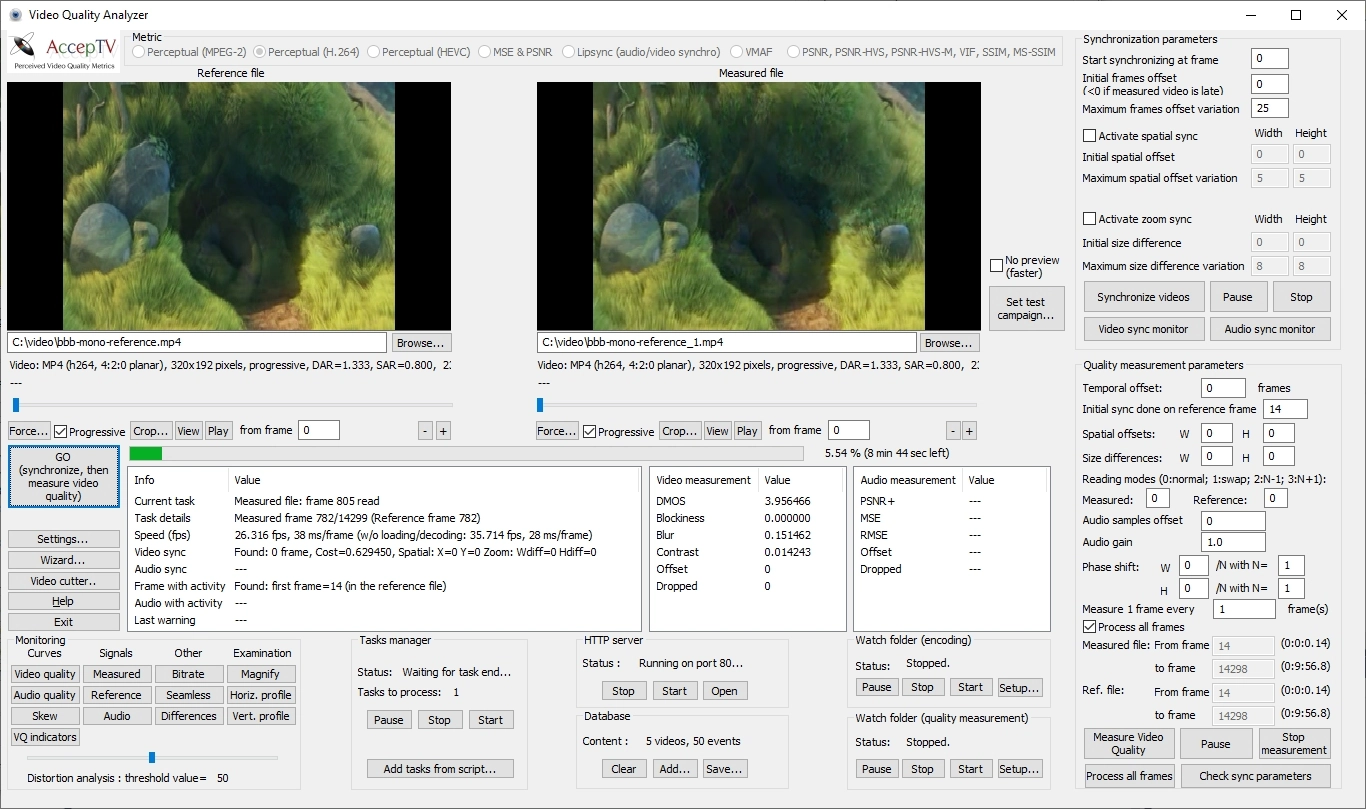
Once a video is loaded, its first frame is displayed. The parameters of its video and audio streams are also displayed: codec, frame dimensions, frame rate, number of frames, duration, audio sampling rate, audio duration, etc.
VQA's graphical user interface also displays lots of other useful information, mainly for synchronization and measurement. In fact, all the parameters that you could need are displayed and are editable.
Synchronizing the distorted video with its reference video
Maybe you're already aware of that but measuring the quality of a video using a reference video requires to temporally and spatially synchronize them. Synchronization is also sometimes called "alignment".
To detect the temporal and spatial offsets, you just have to define the size of search windows. Then VQA will automatically detect the offsets. VQA can even synchronize videos which have different resolutions and/or different frame rates. For example, VQA can measure the perceived video quality of a distorted video in 720p format at 15 frames per second using a reference video in 1080p format at 25 frames per second.
VQA can also process (synchronize and measure the quality) of an audio stream having a different sampling rate than the one of its reference audio stream.
Measuring the perceived video quality
When the synchronization step completes, the detected temporal and spatial offsets are copied in the appropriate fields of the user interface and you can start the perceived video quality measurement and analysis step. In fact, to avoid having to click too often, you can also do both operations (synchronization, then quality measurement) in a single click, thanks to the "GO" button.
Then VQA measures video quality indicators like blockiness, blur, contrast and flatness, and combine them to produce video quality scores highly correlated with human judgment. To achieve that, VQA's video quality metrics having been trained using the results of subjective quality assessment tests performed with human observers.
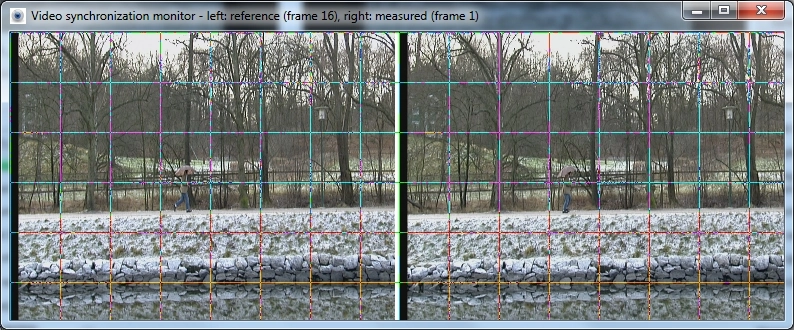
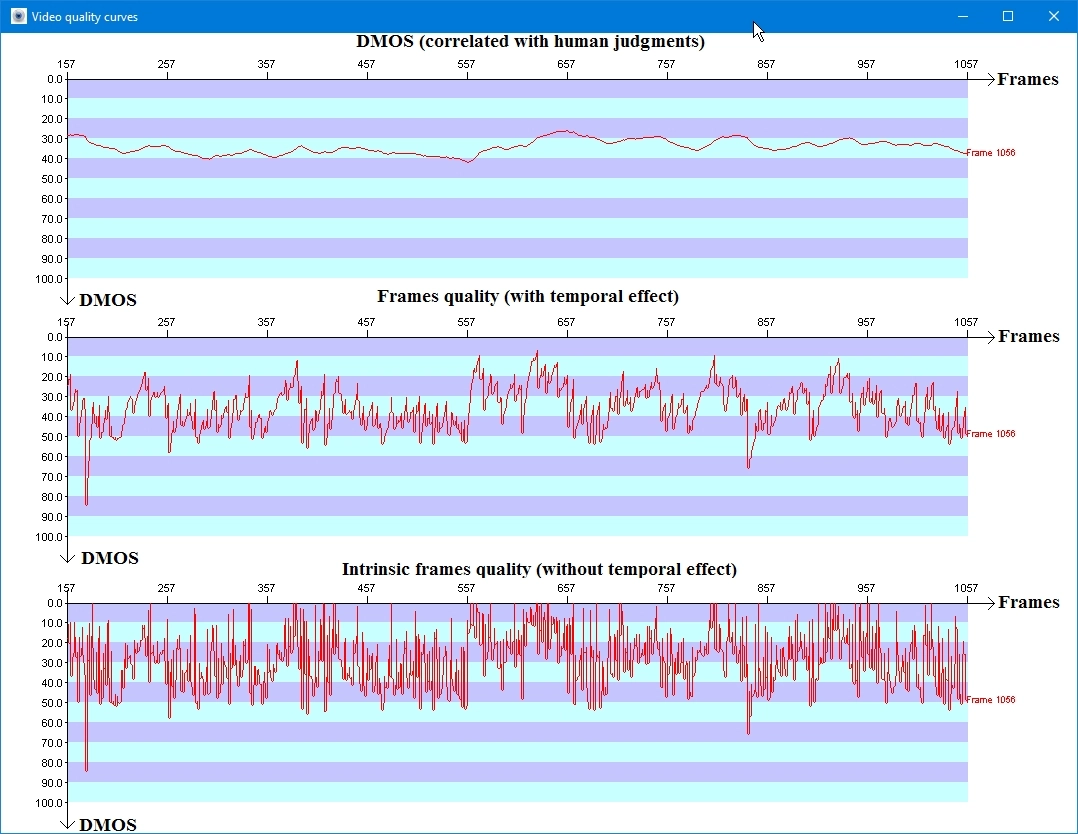
During video quality measurement, many windows can be displayed: measured video frame, reference video frame, seamless view (left part of the reference frame and right part of the measured frame), errors map, video and audio quality curves, video quality indicators curves and bitrate curve.
In parallel of quality measurement, the instant video bitrate is measured for each frame.
Both the synchronization step and the quality measurement step use multithreading. So the more CPU cores you have, the faster VQA works.
Web server
When you've done that (loading 2 videos, clicking the "GO" button and waiting for quality measurement to complete), the perceived video quality score is displayed, expressed in DMOS (the signification of DMOS values is fully explained in the help). That's good but the best is yet to come...
VQA includes its own web server. There is no need to install a separate server (like Apache): VQA's web server is already fully included in the application. This web server enables you to connect from anywhere and get the measurement results, statistics, curves and even quality analysis reports (in several formats, including HTML format so that you can copy/paste it or load it in your favorite word processor, like Microsoft Word for example).
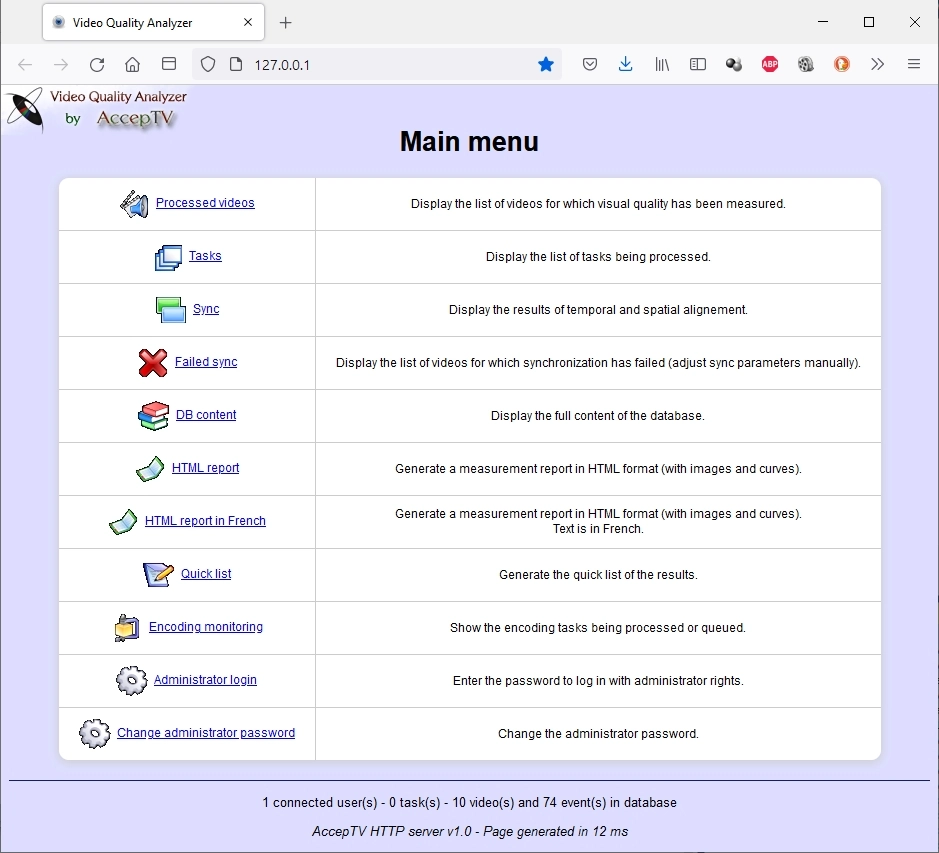
Results
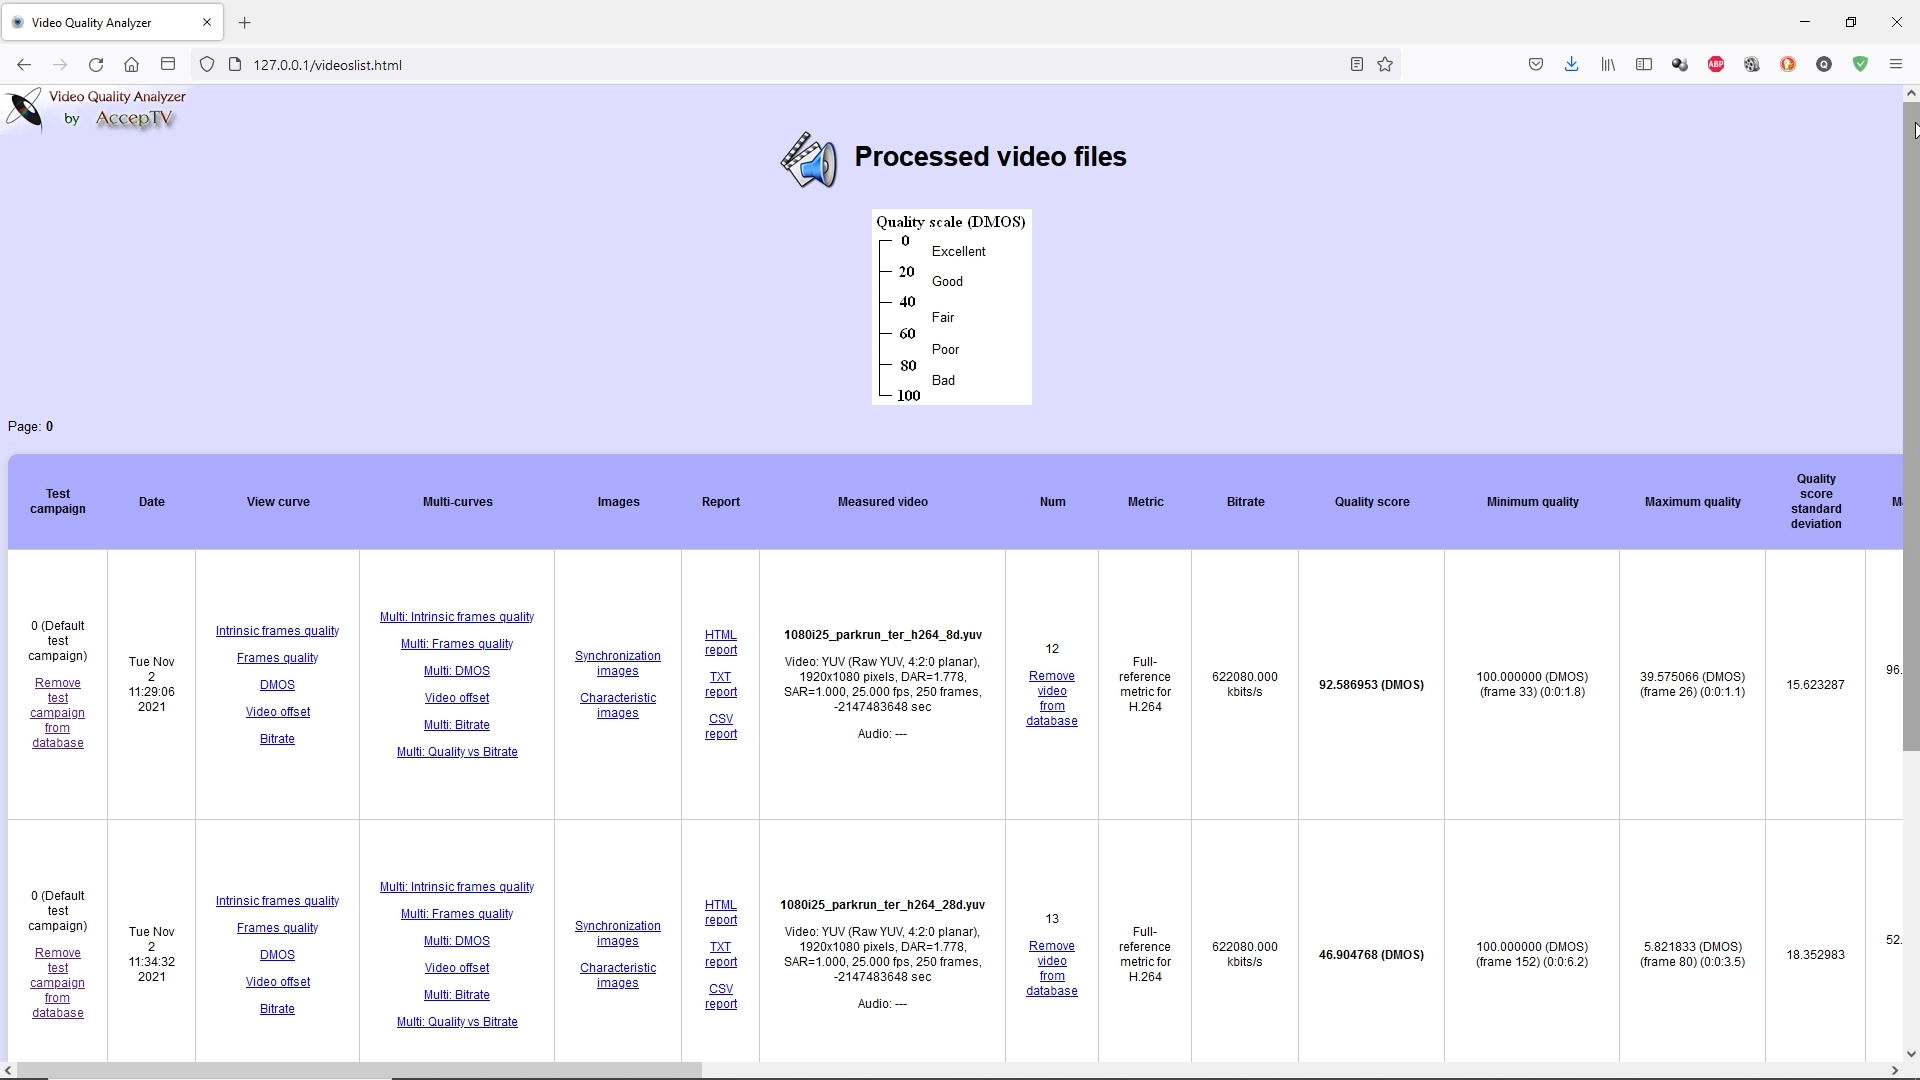
In the main menu, the most frequently selected choice displays the list of processed videos. In this list, each video is represented by a unique number, its test campaign (that enables to gather several results), its file name, its full path, the description of its video and audio streams (codec, dimensions, frame rate, duration, etc...), its video quality score, statistics on video quality (min, max, standard deviation) and parameters used for synchronization. For each video, several links enable you to display the quality curves, the bitrate curve, the characteristic frames. Some other links permit to draw various representations of the perceived quality versus the bitrate. At last, some links allow to generate perceived video quality analysis reports in various formats (CSV, TXT, HTML).
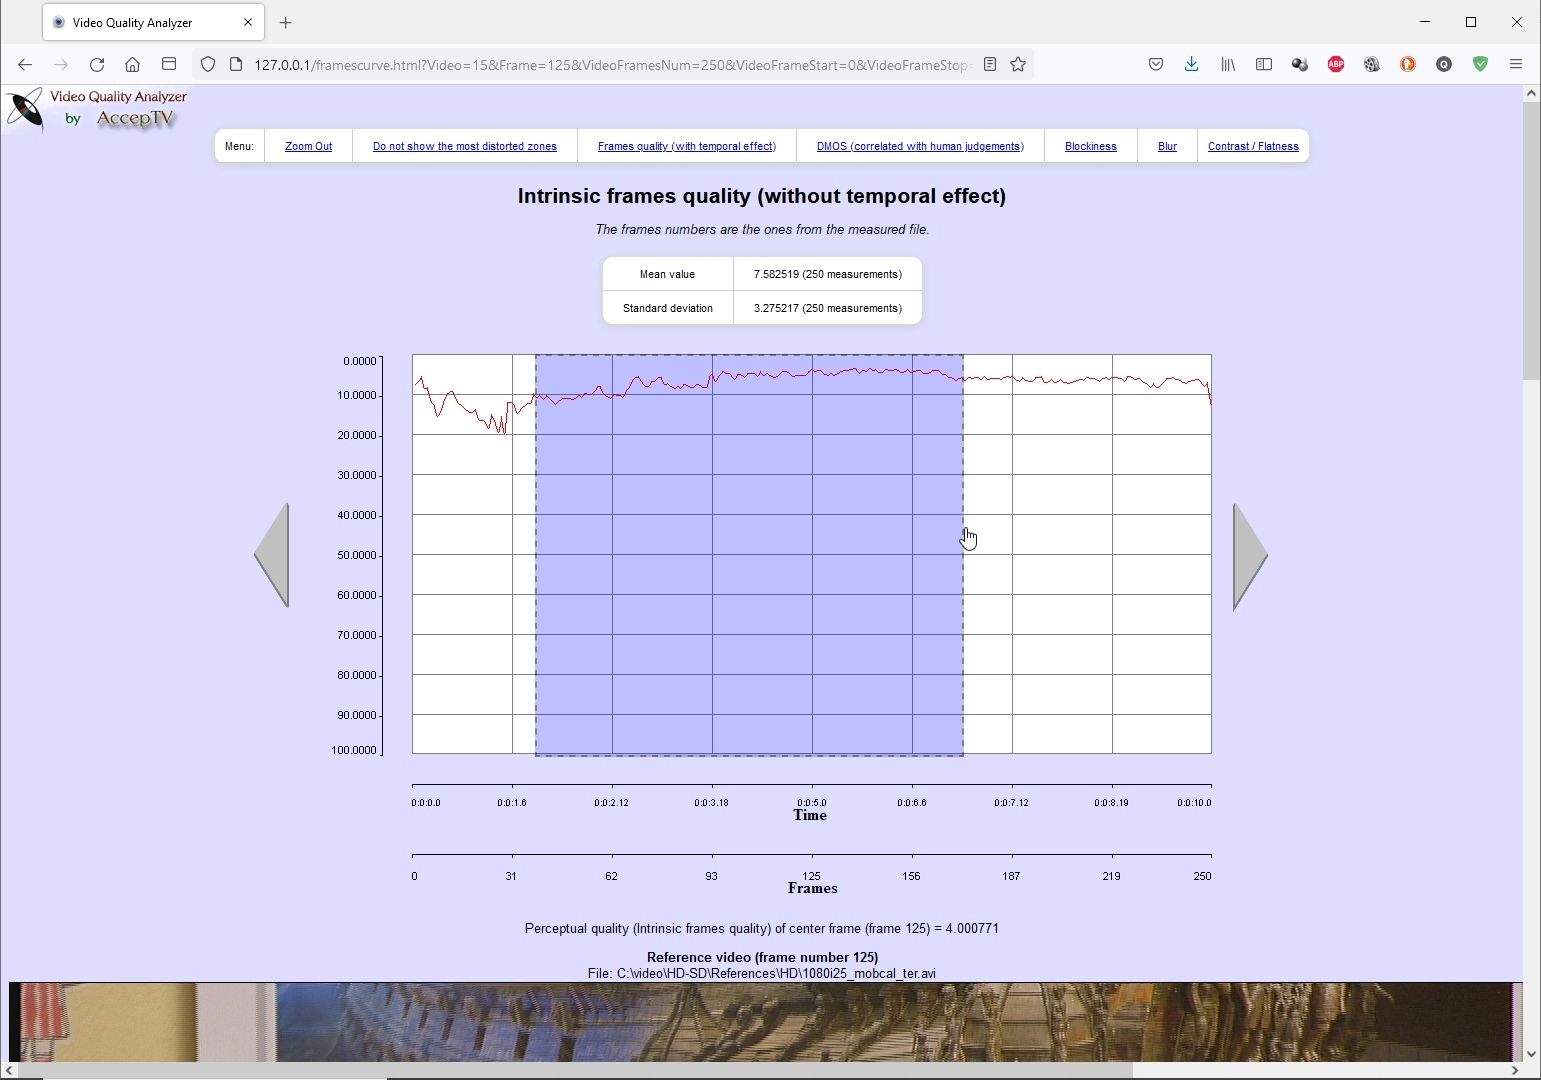
Curves
In the web interface, all curves are interactive: if you click on one point of the curve, it will put this point at the center and zoom by a factor of 2. And if you drag your mouse to select a portion of the curve, it will zoom on this selection. If the frame corresponding to the center of the curve is a characteristic frame, then this frame and its reference frame will be displayed below the curve. And if the distorted frame contains areas that have been distorted beyond an acceptability threshold defined by the user, then these areas will be boxed, so that you can find locate easily. The color of the box indicates the level of distortion (the clearer the color, the higher the distortions). And if the boxes are annoying, you can make them invisible using a single click.
If several distorted videos have the same reference video, then you can draw all their curves on the same figure, in order to compare the effects of different encoders or different bitrates on a given video content. You can also get graphical representations of the perceived quality versus the bitrate. This will enable you to determine the bitrate which is required to get a given quality level.
5 levels of analysis

These different features help the user during results analysis. Indeed, generally we consider that there are 5 levels of analysis. Indeed, let's suppose that you measured the perceived video quality of a video file.
- Level 1: First you'll have a look at the mean quality score. VQA shows it. If you consider that this score is good (or good enough), then you're lucky and your work is finished. But most of the time, you'll think that this score is not good or not good enough (and that you can certainly improve it).
- Level 2: So you'll want to have a look at the quality curve, to see if you always have a constant quality (all along the video) or if you have peaks of quality loss at certain moments. You just have to click on a link and VQA will display this curve.
- Level 3: You detect some peaks and you want to see the corresponding frames, to evaluate the quality of these frames by yourself. Just click on a peak and VQA will display the distorted and reference frames corresponding to this peak. It will also display the curve centered around this peak.
- Level 4: You will then explore the frames that correspond to peaks and try to find the most distorted zones. Thanks to the boxes, VQA shows these zones to you.
- Level 5: Generally, when you have a look at the most distorted zones, you make conclusions like "OK that's very distorted because it was a fine texture for which small details were removed by compression". But the difficulty is that, doing this way, you will only have qualitative conclusions and no quantitative data about the reason of these quality losses. VQA does better, thanks to content classification!
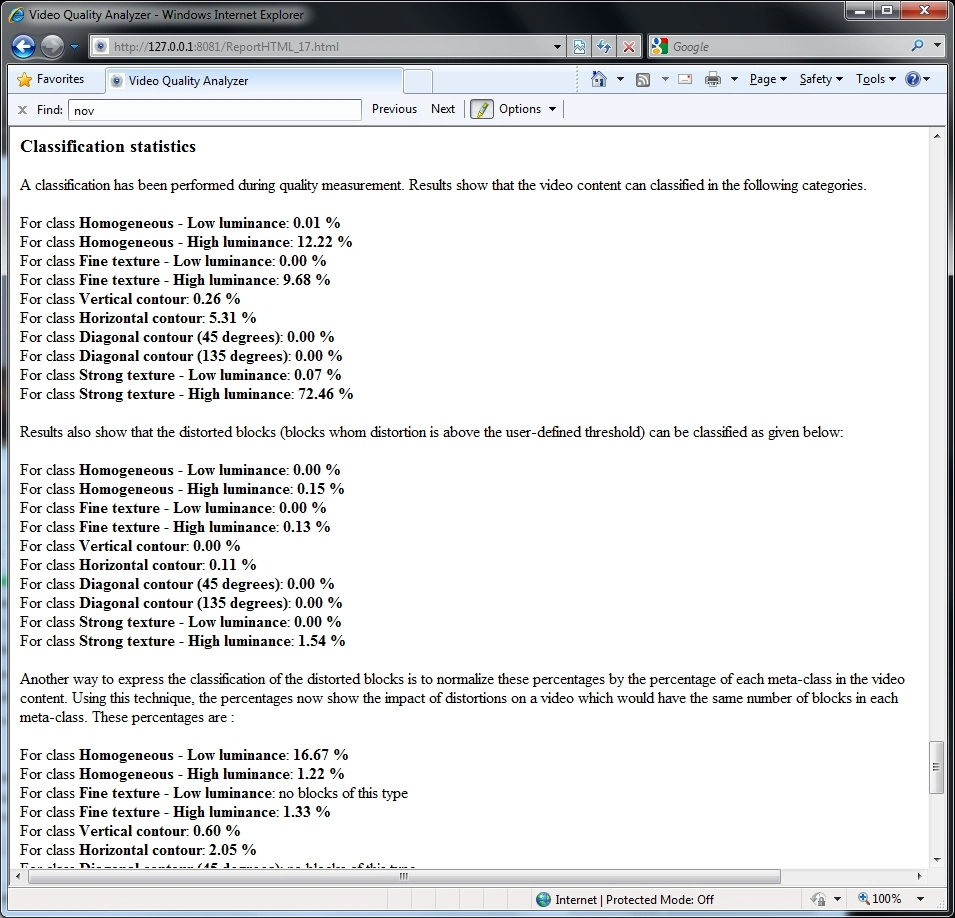
Content classification (patented)
In parallel of perceived video quality measurement and bitrate measurement, VQA also divides the image into several zones. Each zone is classified into several categories like "Homogenous area", "Fine texture", "Horizontal contour", "Vertical contour", "Diagonal contour", "Strong texture". Each category is even subdivided into two types: "low luminance" and "high luminance".
For each category, VQA will measure the number of pixels in this category and the perceived video quality of the corresponding zones.
This enables to display the statistics required for level 5 (see above). Indeed, VQA indicates the proportion of each category (the number pixels from the video belonging to each category), the quality of each category and which category suffers from the most important distortions (in the video and, by normalization, in a video which would contain the same number of pixels in each category). If you work on encoders R&D or if you want to finely tune an encoder, this will enable you to adapt the quantization coefficients to maximize perceived video quality!
This technology is patented and exclusively available in AccepTV's Video Quality Analyzer.
Audio
VQA can also measure audio quality. However, the implemented audio quality metric is simpler than the video quality metric. The audio quality metric is similar to an "improved PSNR" (improvement due to audio gain compensation).
When audio processing is enabled, VQA performs audio synchronization, audio quality measurement, instant audio bitrate measurement and mean audio bitrate computation.
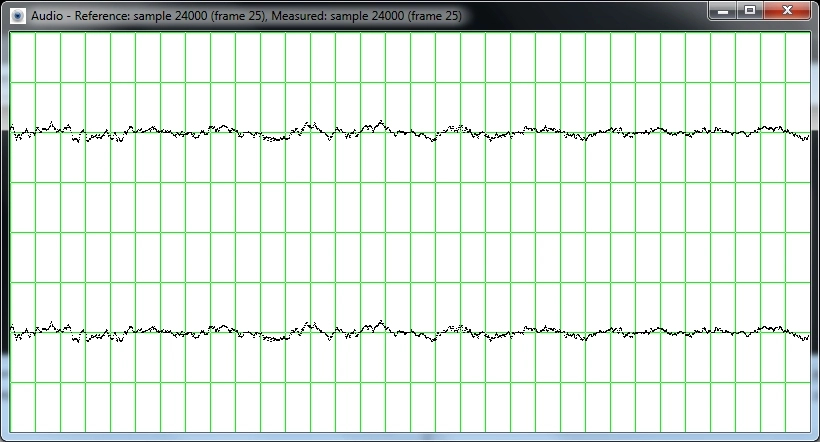
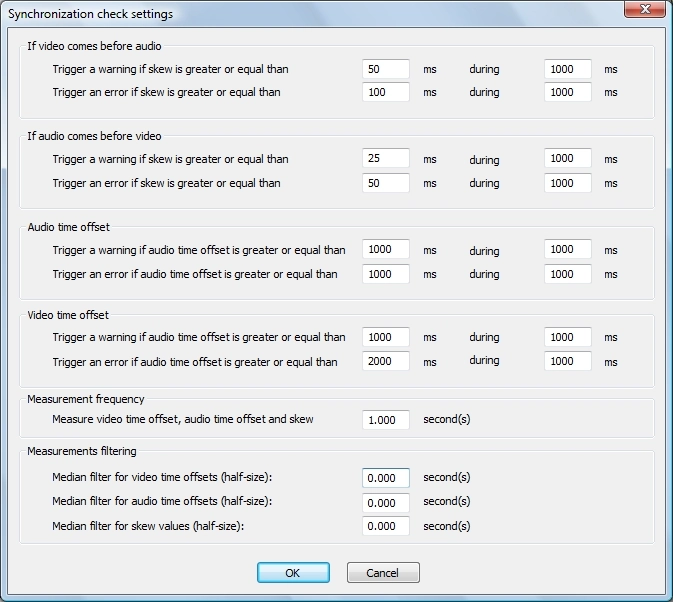
Skew measurement (lip-sync measurement)
Apart from video and audio quality, VQA can also measure skew (sometimes called lip-sync offset) which indicates how audio and video are synchronized.
To do that, VQA uses the same technology as our other product Audio Video Sync & Quality Monitor (AVSQM). VQA measures skew for files whereas AVSQM measures it for live sources.
Like in AVSM, the skew is expressed in milliseconds. Perfectly synchronized audio video signals have a skew of 0 ms (no delay between audio and video). The skew is positive when audio arrives before video (for example, you hear a voice before you can see someone talking) and negative when video comes before audio (for example, you can see someone starting to talk but it takes a while before you can hear the voice).
Measured skew values can be used to trigger warnings or errors, thanks to user-defined thresholds.
Quality-driven encoding/transcoding
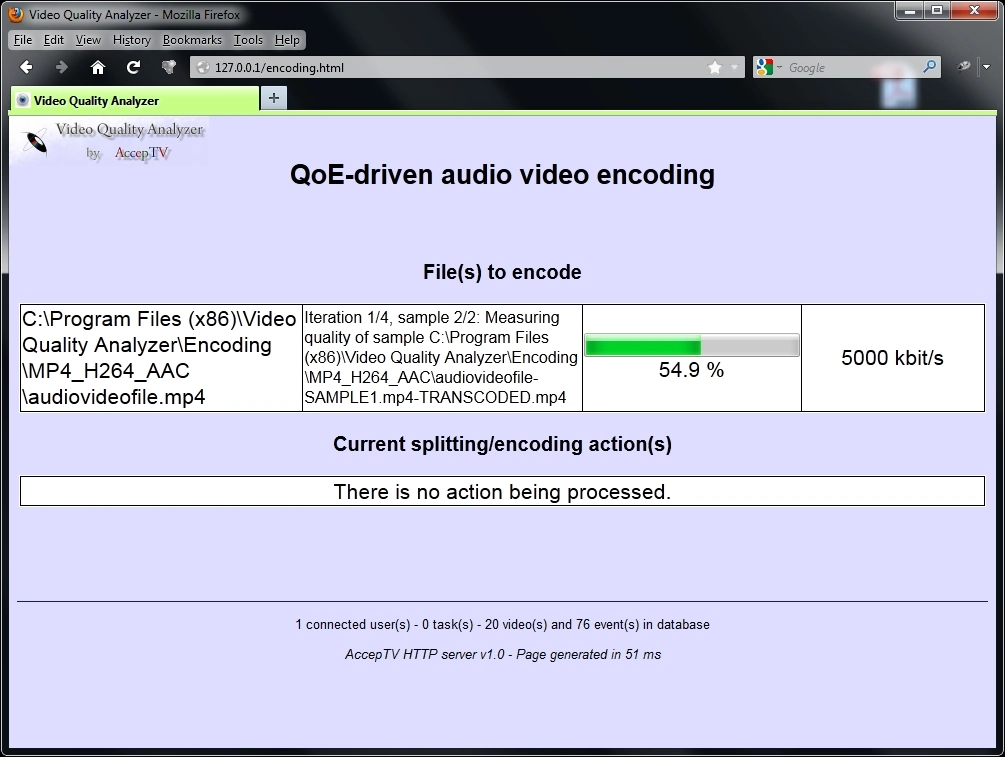
VQA also enables to automatically encode audio video files with the most common containers (TS, MP4, AVI, etc.) and the most popular audio video codecs (H.264, MPEG-2, AAC, MP3, etc.).
And thanks to its advanced perceived video quality measurement technologies, VQA can even automatically determine the optimal video bitrate to reach the quality level you want!
Of course, if you prefer using predefined video bitrates without adjusting them, you can still use VQA's encoding's watch folder to automatically encode/transcode your audio video files.
Encoding is based on a watch folder. When a new audio video file is copied or moved to the watched folder or any of its subfolders, it is encoded using parameters (codecs, container, etc.) which are defined by the user and specified for each folder. Therefore, to encode a given file with given parameters, you just have to copy or move this file to the appropriate folder. And when encoding is finished, a user-defined script can be run (to move the output file to a given folder or to delete the input file, for example).
Other features
VQA contains many other features, among which:
- Tasks Manager: when you click on a button, you don't directly perform an action but in fact you add a task in a queue. This enables you to continue loading files, synchronizing them and measuring them, even if VQA is already working.
- Watch Folder: it enables to detect every file appearing (copied) in a folder (or its subfolders). For each new file, several rules (based on filenames, especially on end of filenames) can be applied to determine the possible names of a reference file. If a reference file is found, the quality measurement is launched. The Watch Folder enables to monitor a file-based encoding process using VQA (for VOD, for example)
- Automation methods: to facilitate the use of VQA with an important number of files, VQA can load scripts or be used in command line (with arguments).
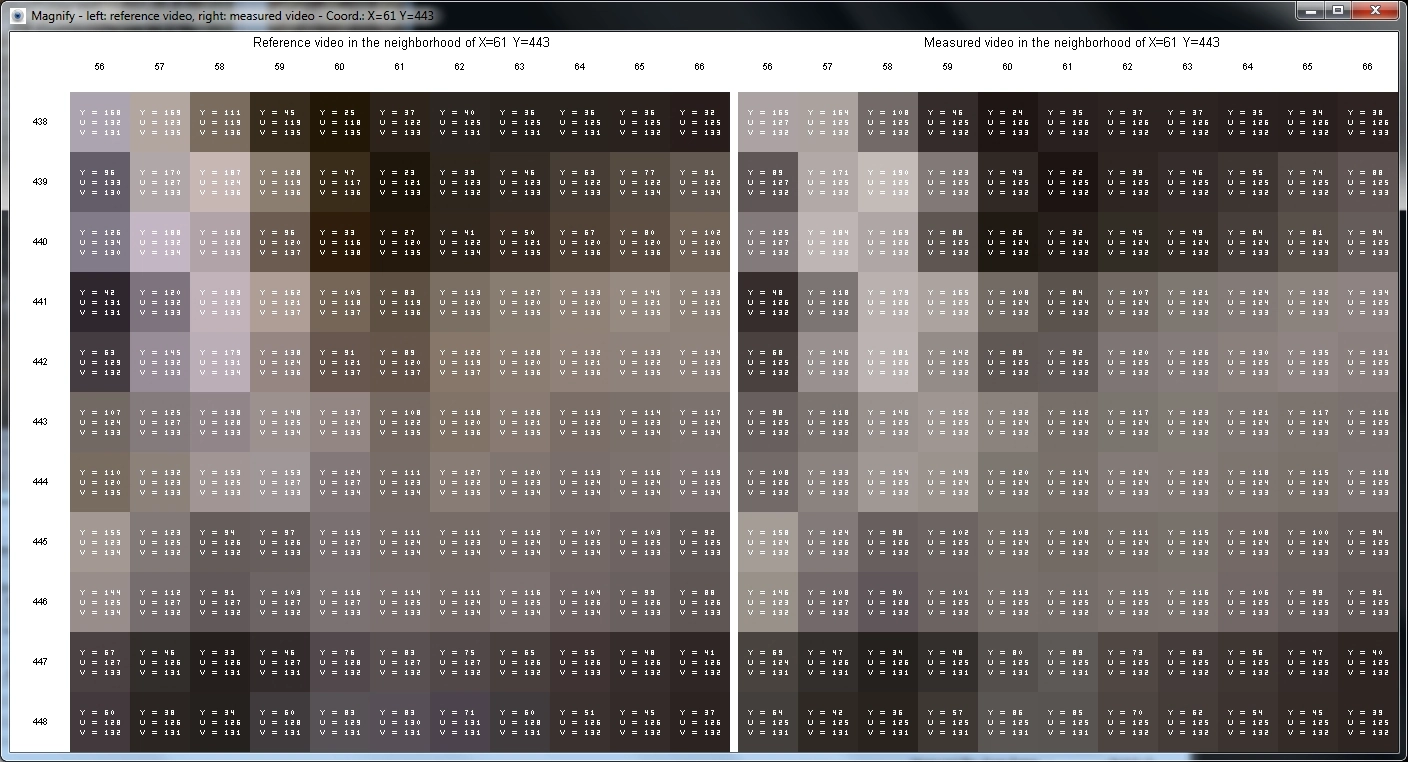
- Magnifying glass and signal profiles: to explore the images at pixel level, view the Y, U and V values of each pixel and to compare two frames coming from two different files, a magnifying glass is available, along with horizontal and vertical signal profiles displaying. These windows show the image content in the neighborhood of the mouse cursor's position.
- Video Cutter: a tool to cut both the reference video and the measured video into several video clips, using start/stop markers for the reference video and using synchronization for the measured video. Video Cutter simplifies the use of a long duration video which contains different contents (for example: sport, movie, news, cartoon, concert, etc.) by splitting this long duration video in several video clips. Each video clip will contain a single content type (one video clip for sport, one video clip for movie, etc). Thanks to it, you'll be able to have one quality score for each content type (one quality score for sport, one quality score for movie, etc).
VMAF in VQA
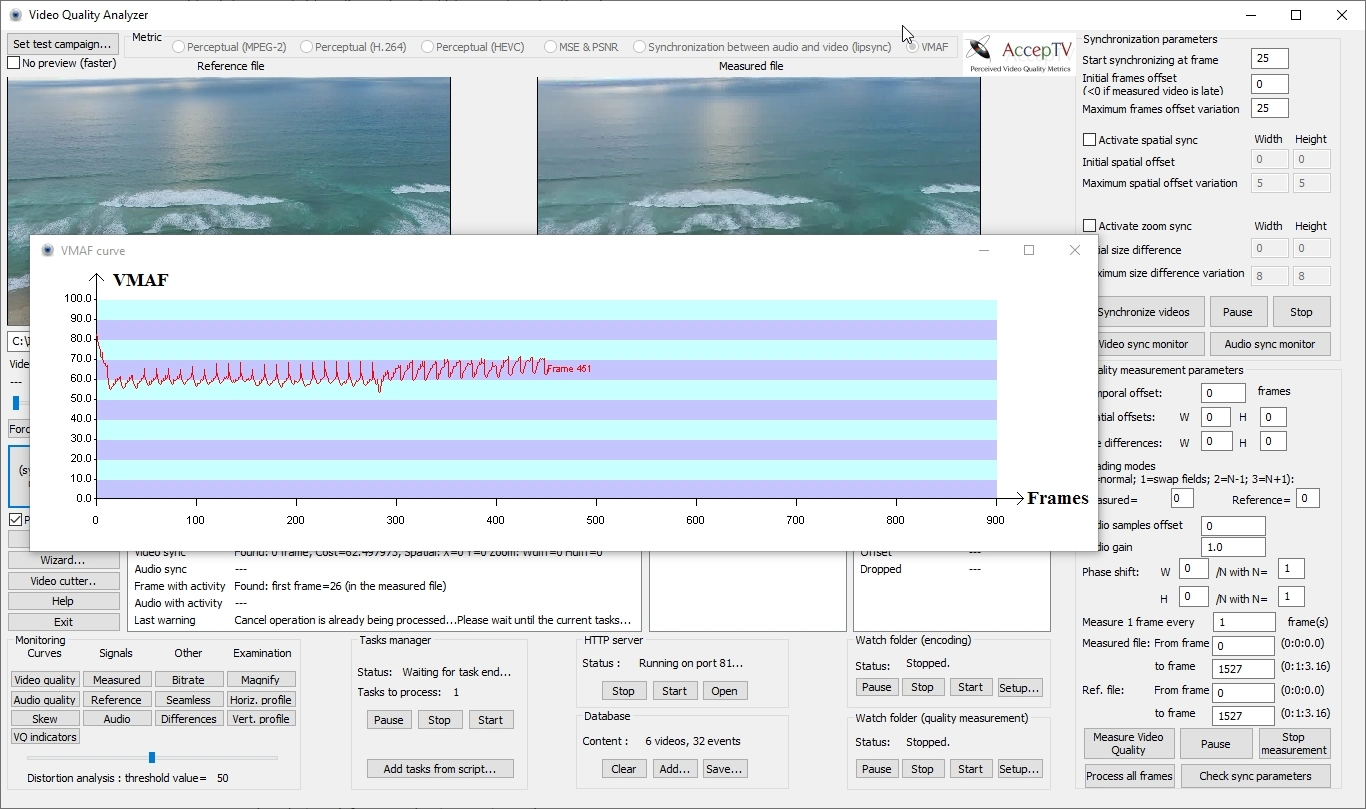
VQA includes AccepTV's full-reference video quality metrics but also Netflix's VMAF metric.
By using VMAF in VQA, you can compute the mean VMAF value of each processed video but you can also:
- Compute VMAF for any supported file format (*.mp4, *.avi, *.ts, etc.) and not only for raw YUV files
- Compute VMAF for videos which are not temporally synchronized thanks to VQA's automatic synchronization
- Compute VMAF on video files of any duration (no limitation)
- Get the VMAF value of each processed video frame
- Automatically see which video frames have the minimum and maximum VMAF values in a video file
- Get curves of VMAF values with respect to time
- Trigger alerts when VMAF scores are too low
- Measure audio quality in parallel, using the "improved PSNR" audio metric
With all these features (and more, like scripting), VQA is a perfect tool to use VMAF!
Other metrics in VQA
VQA includes the following metrics:
- Our full-reference perceptual video quality metrics (3 metrics, dedicated to MPEG-2, H.264 and HEVC)
- MSE & PSNR
- Lipsync metric
- VMAF
VQA also includes these other metrics:
- PSNR-HVS: Peak Signal-to-Noise Ratio taking into account Contrast Sensitivity Function (CSF)
- PSNR-HVS-M: Peak Signal-to-Noise Ratio taking into account Contrast Sensitivity Function (CSF) and between-coefficient contrast masking of DCT basis functions
- VIFp: Visual Information Fidelity (pixel domain version)
- SSIM: Structural Similarity
- MS-SSIM: Multi-Scale Structural Similarity
For all quality metrics, the reference video and measured video can even have different resolutions and/or different frame rates. For example, VQA can measure the perceived video quality of a distorted video in 720p format at 15 frames per second using a reference video in 1080p format at 25 frames per second.
With all these metrics (and its unique features), VQA is certainly the most complete tool for full-reference video quality measurement.
Conclusion
With all these unique features and its elaborate video quality metrics, VQA is definitely the solution that will adapt itself to answer your needs for video quality measurement and analysis. Ask for an evaluation version today!
If you are interested by VQA but if you have only a punctual need or if you don't have the necessary manpower to fully exploit one license, please note that we also propose consulting services based on the use of VQA.